View Benchmarking
Add views to score query performance alongside RAM. The chosen order balances both, because the lowest-RAM order isn't always the fastest one.
Config
{
  "instance": "tm1srv01",
  "cube": "Sales",
  "views": [
    "Optimus_Daily_Drill",
    "Optimus_Monthly_Summary"
  ],
  "executions": 5,
  "output": "xlsx"
}
By convention, benchmark views are prefixed Optimus_ so they're easy to spot. They should be representative of the real workload (drill-down patterns, filtered subsets, period-over-period comparisons). Avoid trivial views (a single cell, the full cube unfiltered), because they don't differentiate orders.
Run command
Reading the composite query time
Each iteration logs both metrics:
Iteration 5 - Testing order: ['Periods', 'Sales', 'Currency', ...]
Iteration 5 - Result: RAM [GB]: 3.12 - Query [s]: 0.84321
Where:
- RAM [GB]: total cube memory after applying the order
- Query [s]: composite query time, the median across views, where each view's time is the median of its N executions
Final report
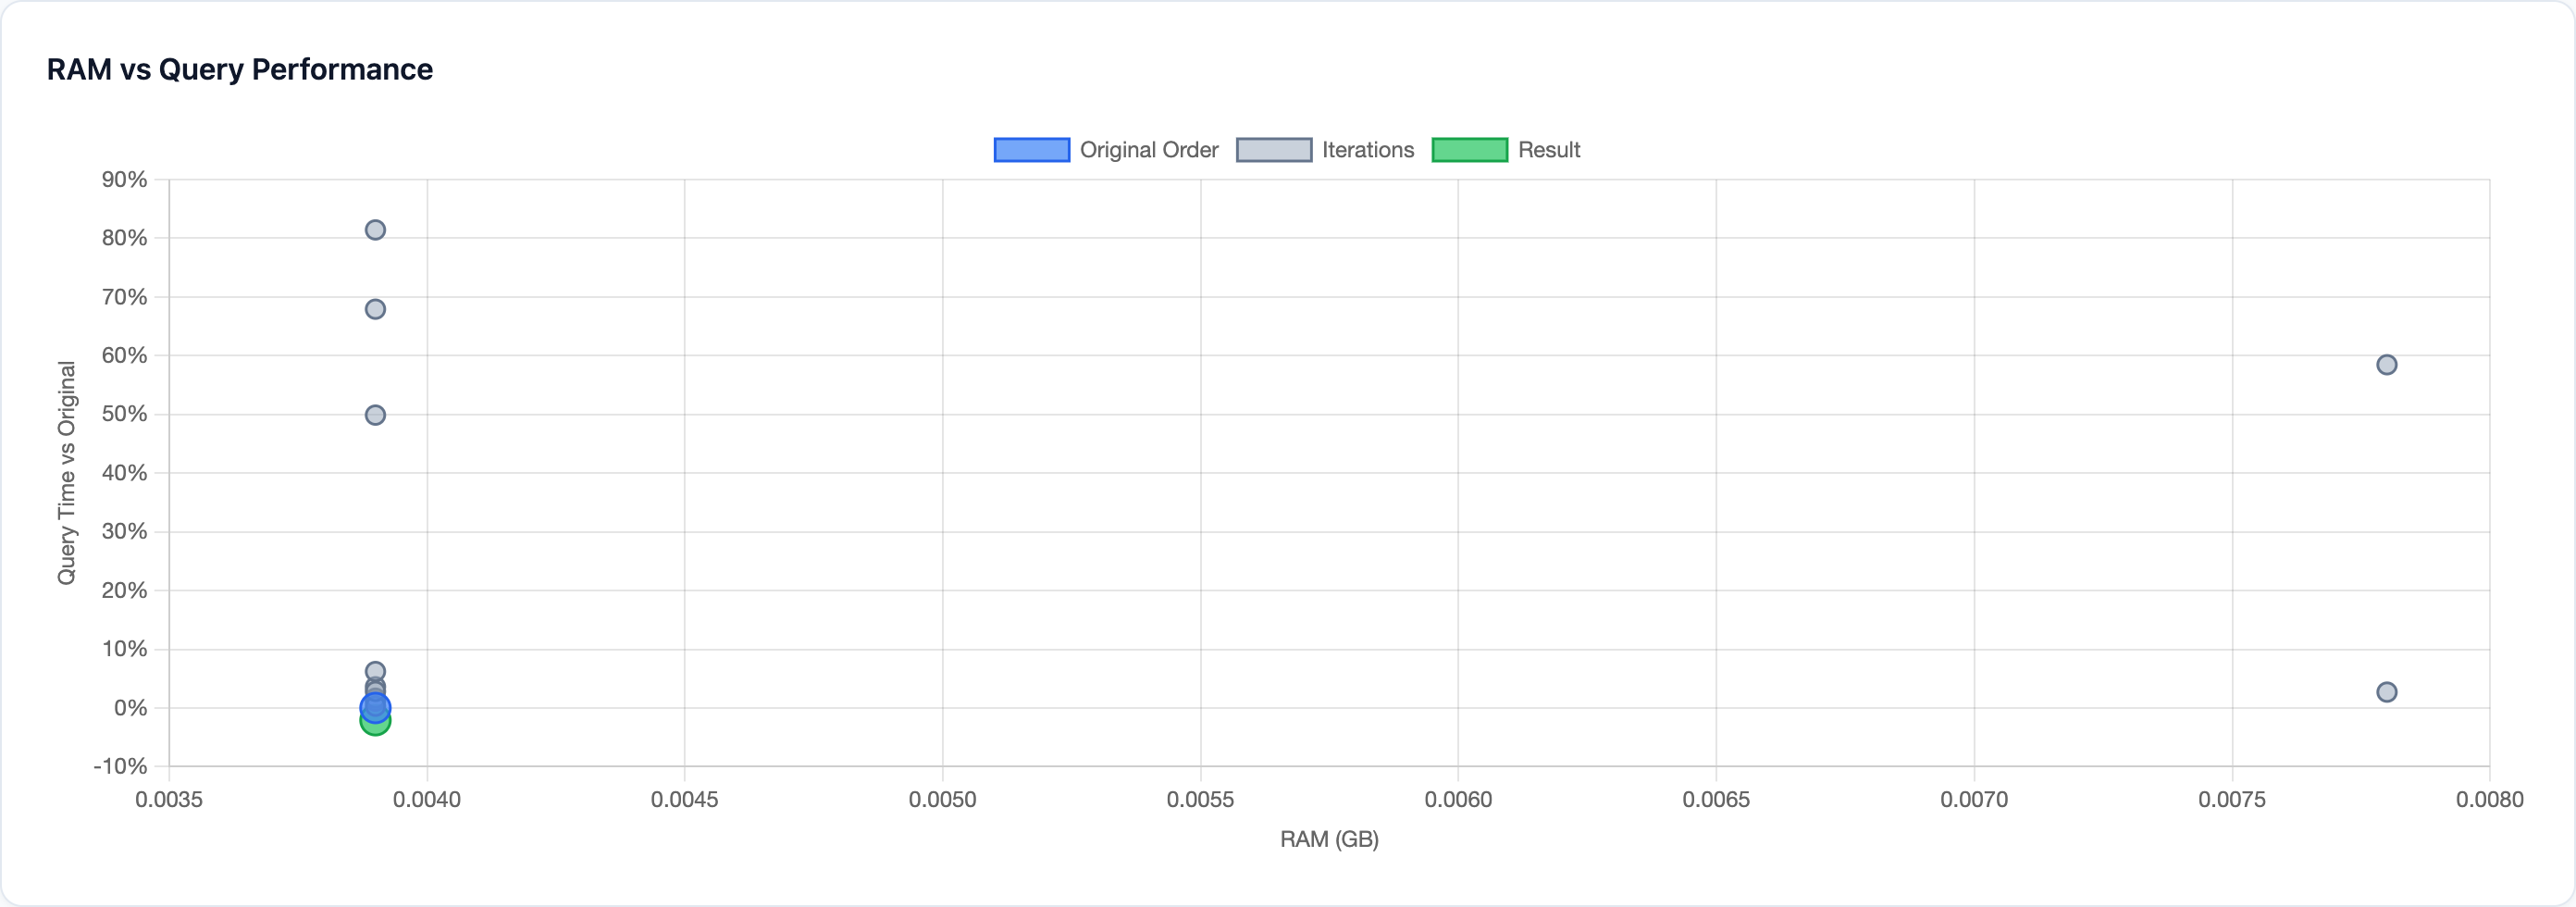
Open the generated .html. The podium shows a card for the Best Overall order (the one OptimusPy recommends, chosen because it's within tolerance on RAM and query time at once) next to the single fastest query and the single lowest RAM. Those can be three different orders, which is exactly the point. The scatter plot shows every order on RAM (X) vs query time (Y); look for orders that are good on both axes, not just the winner. See how the best order is chosen.
Designing benchmark views
Good benchmark views:
- Filter on dimensions you actually filter on in production (the order matters most for these)
- Cover 2-4 different query shapes (drill-down, summary, period comparison)
- Are expensive enough to differentiate (sub-100ms queries don't tell you much)
- Are stable (no random parameter changes between runs)
A view that triggers a 30-second TM1 query on the worst order and 0.5 seconds on the best is the most informative.
Sample file
samples/optimize.json is a starting point; add your view names to the views array.